
What it really takes to create awesome excel reports ?, is that your skills or technical knowledge?
If you have been working in a financial industry, you would have heard the term excel reports very often.
I think there is nothing wrong if I say your day starts & perhaps ends around a bunch of excel reports, graphs & dashboards.
There was a study conducted by APQC about “which technology most of the FP&A departments use in their organizations”.
As per the study about 39% of the organizations have been using “Spreadsheets” & 56% of them using “combination of spreadsheets and dedicated software”.
So, what’s your take on the research?
In any which way spreadsheet reports are essential for conducting analysis & to present your data.
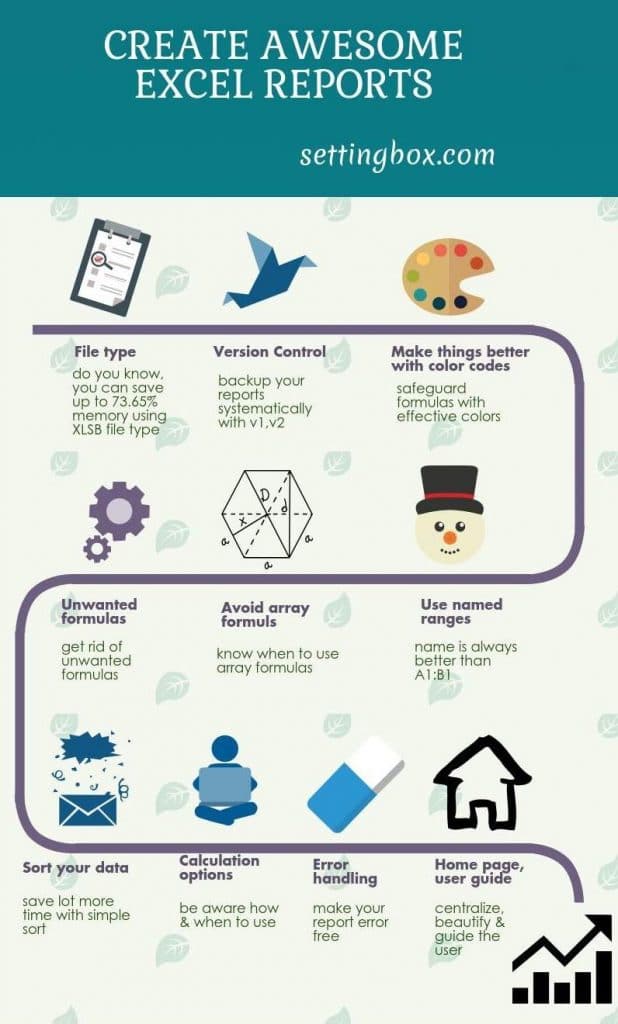
Tips to create awesome excel reports:
Mynda Treacy from Udemy blog says “Excel dashboard reports are the new buzz word that employers are currently looking for”.
Perhaps, it’s true, considering all the facts I’ve created infographics to help you understand better.
So, creating reports using excel is a new skill that most of the employers are currently looking for; hence why don’t you invest a little time to get familiar with those?
Without further delay, let me share my 10 tips that you should consider before working on any new report.
1) Workbook file type – speed up your analysis & save up to 73.65% memory
Do you know, choosing right workbook file type can safeguard your report from future crashes? Yes indeed, it’s true and tested by most of the industry experts.
Based on my 6 years experience & many online reviews, saving excel report in “. xlsb” (excel binary workbook) file type will drastically reduce the size of your workbook, and more importantly it will support all kinds of futures.
For example, if you have a huge data in your report and you also want to use macros to make it more flexible, than your ideal option will be binary workbook format.
What is a binary file type?
In computer terms binary means instructing the machine to run based on ‘0’ & ‘1’s.
So you’re instructing excel to save your data in ‘0’s & ‘1’s instead of actual text in a memory, hence it will take less loading time & less memory.
Do you know “Settingbox” in binary format?
I have used online unit conversion tool to convert ‘setting box’ text to binary format and got the below result. It looks strange right?
01010011 01100101 01110100 01110100 01101001 01101110 01100111 01100010 01101111 01111000
Why should you use the Excel binary workbook file type (Case study)
Like I mentioned above, there are many reasons why you should use a binary format, however I‘m little curious to know how much impact it has in reality.
I’ve selected one of my old report to test this; here are some of the mind blowing facts you may want to know.

Above case study is a clear indication to show why you should use excel binary workbook type for your report(s), so now tell me, what do you think?
The limitations of using xlsb format:
1) One major limitation is backward compatibility, binary workbooks will not work in excel 2003 and prior versions
2) It could show some errors while doing a lookup from different file formats, because of row’s or columns count
2) Version control – Know how to backup your data
“Thank god I have a copy of my report” is always better than “Oh my god!, I didn’t save my report, I’ve to rework”.
Just imagine, you have a very tight deadline & working very hard to finish one of your reports. You have already put lots of effort on that and you almost reached to completion stage. Suddenly, your excel crashed or closed accidentally before saving. What will happen?
For sure, you’ll have to rework, on top of that your manager will be behind you until you finish. That’s so weird right!! So, here is a simple way to avoid this situation.
What is version control?
VC is a method to record recent changes to a file and then recall whenever you want it later. VC is very often used method in IT industry; however, we can also take advantage by using in a right way.
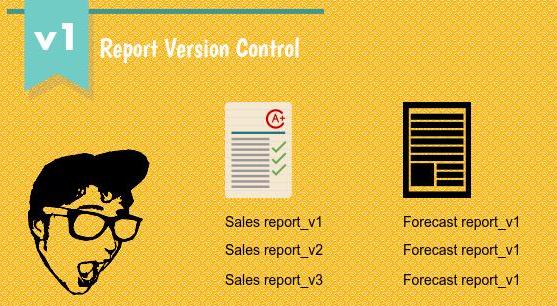
It’s very simple, you just need to create a folder where your actual report is saved and name it as “backup”. Then save recent copy of your report in that folder. Similarly, whenever you do some noticeable changes or updates to your report, you’ll have to do “Save as” and then save your report with a suffix of v1 or v2 or v3 and so on.
By doing this, you’ll save your most recent versions in an order, so that you can go back and choose the right version whenever you need.
Here are some best practices
1) When you work on a new report, make sure to save first & than work
2) Always have a habit of hitting Ctl+S every now and then, you need to practice for a few days than automatically your fingers will take care of that work
3) It’s very essential to have a backup folder & save your recent work over there
4) Have a habit of using version control method to prevent your work from possible losses
3) Color codes – differentiate formulas cells & data cells
Building wonderful reports using many formulas and excel inbuilt options are one of the biggest challenge, at the same time, there is growing concern on how well you can differentiate your formula cells & data cells to avoid messing up with formulas.
Oftentimes, you would have spent lots of time while working with formulas to get desired results. But what if you or someone (maybe user of that report) deletes your formula by accidentally?
Better solution:
There was a wonderful article written by Neal Patel on color psychology in marketing, he says “most of the well known brands often recognized by their colors”. So, can’t we use appealing colors to make our reports more beautiful? At the same time, we can also get rid of the above problem.
Without a further delay here is a way out.
Most of the excel experts use “light yellow” color to indicate data cells, where the user can go ahead and input their data.
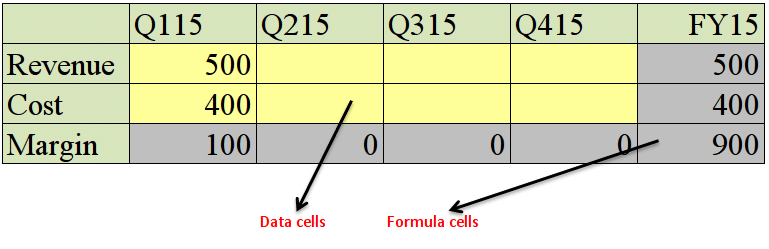
Use “Light Gray” color to indicate non-editable cells, where your formulas are stored.
Some more tips:
- Make use of conditional formatting in your reports & take some advantage by using visually appealing colors
- Use “Green” for growth, “Red” for the decline in your numbers to make it more meaningful.
- One picture or graph is equivalent to 1000 words, hence use colorful graphs to explain what is happening
- You can also use color patterns to beautify your report, but don’t overdo it
4) Get rid of unwanted formulas
Excessive use of formulas may cause performance issues in your report. For instance, you may have used vlookup formula to pull data from different workbooks; however, you just forgot to remove those after pulling the data.
So, What’ll happen? Unnecessary formulas will make your report slower than what it should be, and often your report may take little longer time to do calculations. But the worst part is, crashing your report at the time of working.
According to Susan Harkins from techrepublic.com “cell references and calculation operations are the main performance vampires”, so using unnecessary cell references will create a lot of performance issues in your report.
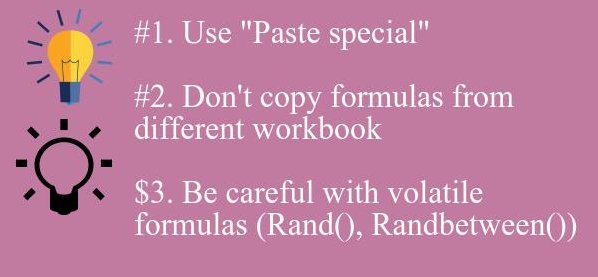
Possible solution(s):
- Do not keep unnecessary formulas in your reports – use paste special and convert them as a value
- Do not copy formulas from one workbook to another – if you do so, your formulas will carries various cell references those are no longer needed
- Be careful with volatile functions – Functions like RAND & RANDBETWEEN will generate random numbers as and when you hit a refresh button or every time you save your excel report
5) Excel Array formulas – use only when you out of other options
Array formulas are the most sophisticated formulas in excel, used to perform very complex calculations with one or more than one criteria’s.
According to mrexcel “about 95% of excel users don’t know how to use CSE (Ctrl+Shift+Enter) or Array formulas”. So where do you stand today? If you think you don’t know, then it’s a good idea to spend some time to learn.
There are lots of advantages of using array formulas in your reports, but unlike any other functions these are not out of its limitations, so use these formulas carefully.
To give you a better example, recently I’ve had a chance to build one of the complex report in my office. I thought I could give it try with array formulas. So, I have built a report using these formulas & at the time of testing I got to know that it was taking almost 3 to 4 minutes to update or refresh.
I had one of the finest computer (i7 processor, 16gb RAM), on that it was taking around 4 minutes to run, but what about systems with low end processor and less memory?.
In spite of all the efforts that I had put in to build that report, I have to look for other alternatives in place of array formulas.
Hence it is always a good idea to know where & when you can use these formulas, so that you don’t have to waste your time & effort.
Read also: 5 Unconventional Ways To Save Money Using Your Credit Card
6) Use named ranges – names are better than A1:B1
Often times, many excel users (including me) find using names for ranges will be a good idea instead of default cell references in their formulas. As a human being we always have a difficulty to remember combination of unrelated numbers & letters. But when it comes to excel it is even more difficult, because, cell references will have letters, numbers & symbols.

For example, “Revenue – Cost = Margin” is always better and easier to remember than “A1-B1 =C1” in excel report. According to thecompanyrocks “named ranges are easier to write, easier to remember & easier to explain”.
As per my opinion, excel reports with clear named ranges in their formulas are more superior than, reports with default references. Especially when it comes debugging your formulas you’ll find it a lot easier than the default reference.
Problems with the named ranges:
One of the most criticized point when it comes to named ranges is: by default your defined name is not dynamic in nature, whenever there is a new item in your list, your range name will not get updated automatically.
To overcome the above problem, most of the excel users have been started using dynamic named ranges using OFFSET & COUNTA formulas.
7) Leverage “Sort” option to speed up your calculations
Do you know, sorting your data will make your workbook 4x faster?
I’ve been told that, we can increase workbook speed by sorting data in a report. I thought that may not be true, hence I wanted to test this first before I make any changes to my reports.
I’ve used a data sheet, where I had around 100,000 rows of unsorted data. As a regular practice, every month I was filtering unwanted products from the data and then I used to delete entire rows by doing “CTL -“.
Since I had lots of data in my workbook, it used to take around 1 to 2 minutes to delete filtered data. Now I’ve done the same procedure with sorting.
Surprisingly It worked like a champ!!, everything was finished within 30 seconds. If you have used many Vlookup’s or Match & Index functions in your report(s) then you must sort your data to take speed advantage.
Here is what happened:
Excel sort function will arrange your data in a systematic order based on the sort criteria that you will select.
Since the products need to be deleted in an order, excel will not spend much time on searching for the match, instead it will delete arranged data quickly.
8) Don’t mess up with “calculation options”
The term excels formulas are not working, often heard because of calculation options. So, what are calculation options in excel?
In simple words, it’s an option given to the user to instruct ms excel weather to perform calculations as and when something updated in a report, or you want to excel to perform calculations on a regular intervals.
Here is what it does:
You can find calculations options under Formulas tab. As a default setting it’ll be set to “automatic”, it means, whenever you make any changes to your report/excel file, the changes will reflect automatically.
The other one is “manual”, which means, the changes will not reflect automatically, instead user has to manually refresh every time to get updated results.
Calculation options good or bad?
It’s neither good nor bad. This option is completely user specific, if user doesn’t know how to use, then he’ll end up with incorrect results in his report. At the same time, you can reap a lot of benefits if you know how it works.
It is always advisable that, if you’re working with large sets of data then only set this option to “manual” until you finish. Once you’ve completed working on your report make sure to set the calculation option to “automatic”.
What you need to know:
Excel calculation options are completely workbook specific, once you make any changes in your report, it’ll remain until you go back and change.
There is a misconception about this option; if you open same report in different computers, then the option will automatically change based on his/her settings, but that isn’t true.
9) Error handling – make your report error free
One of the biggest challenges in the course of creating awesome excel reports is make sure that your reports are free from common errors. Nobody likes to see nasty #VALUE or #N/A type of errors in their dashboards or at least in the reports.
As per the study conducted by the University of Hawai, “Spreadsheets, even after careful development, contain errors in 1% or more of all formula cells”.
Types of errors:
#1 Excel defined errors: Most of the excel users would have already aware these kinds of errors, because they have been very well defined & documented. For example, if you see #DIV0! in your report, it means you formula have been divided by zero. As per mathematical rules division with zero is not allowed.

Tip: Leverage IFERROR or ISERROR formulas to identify errors and take necessary action
#2 User specific errors: These types of errors, mostly show up due to human fallibility but not by evil intent. The potential impact of these kind of errors are most likely very high compared to excel defined errors. The biggest problem is, there is no such system to identify & alert the user.
According to “Freeman (Freeman, 1996) cites, data from the experience of a consulting firm, Coopers and Lybrand in England, which found that 90% of all spreadsheets with more than 150 rows that it audited contained errors”
Here are some user specific errors:
1) Not aware of BODMAS rule: Even today 50% of the excel users don’t know how excel will perform calculations. There is a serious gap between user understanding and excel calculation methodology.

Every calculation in excel will be completely based on the mathematical rule called BODMAS (Brackets first, Orders (IE Powers and Square Roots, etc.), Division and Multiplication (left-to-right), Addition and Subtraction (left-to-right)).
For example, 2+5*3 =?, we immediately say 21, but the correct answer as per BODMAS is 17, if you want to test, please copy & paste same numbers in excel and see, the result will be 17.
Solution: Please consider BODMAS rule while building formulas
2) Improper testing mechanism: unlike any other software product testing, we don’t have sophisticated testing tools to find out these kinds of errors. The best method as far as I know, is to test each and every formula as and when it is built, with at least two to three different sets of data (I know it is time consuming, but in the long run, it pays off).
10) Home page, user guide & presentation – be yourself in user shoes
Somehow I strongly believe, presentation is also equally important as much as formulas, VBA code & logic’s in any report. It’s not just about colors & pictures, it’s about how you present your tables, how you manage navigation, how you make use of available options to bring amazing results.
According to John Berger’s book “Ways of Seeing” – “Seeing comes before words. The child looks and recognizes before it can speak”.
Just to give you an example, every time when Microsoft releases new version of excel or maybe MS office, they will come up with different user interface. If you observe closely excel 2013 user interface is far more advanced than excel 2003, why?
Tips to beautify & finalize your report:
1) If you have multiple worksheets in your report, it’s always a good idea to have Home page & use hyperlink option to link all your sheets for better navigation.
2) Try to put a user guide of the report (you don’t have to write point to point, instead just a brief how to guide will serve the purpose)
3) Present your data with graphs & charts
4) Try to use conditional formatting for changing cells to present trends
Note: Do you know, excessive use of formatting will increase workbook file size and sometimes it lead to crashes, hence consider using minimum formatting with maximum benefits.
Conclusion:
The main purpose of any report is to provide valuable information with pinpoint accuracy. So, the entire intent of creating this guide is to identify best practices & leverage them to create awesome excel reports.
Since you know all the best practices with examples, it’s time to go back and start implementing from now on. Let me know what you think.